Support and Resistance in Gold: How XAUUSD Really Behaves at Levels
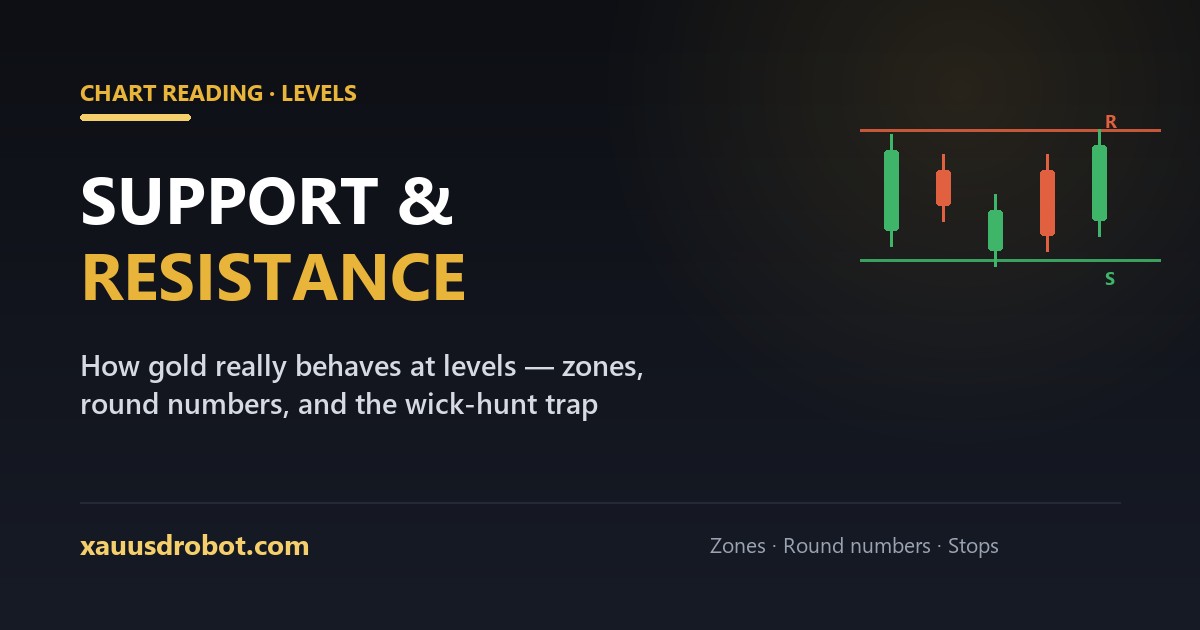
TL;DR support and resistance are price zones where buying or selling interest has repeatedly clustered — floors and ceilings the market remembers. On gold they matter enormously, with two XAUUSD-specific twists: round-number magnetism (prices like 2400/2450/2500 act like magnets and battlegrounds) and the wick-hunt — gold routinely probes just beyond an obvious level, triggers the stops parked there, then reverses. The professional response: draw zones not lines, demand confirmation at levels, and place stops beyond the wick zone, not at it.
What support and resistance actually are
Support is a zone where falling price has repeatedly found buyers; resistance is where rising price has repeatedly met sellers. Levels form for unmystical reasons: unfilled orders cluster at prices the market has visited, traders anchor to visible highs/lows, and everyone watching the same chart creates self-fulfilling reactions. No magic — just memory and order flow.
The critical mental upgrade: levels are zones, not lines. Gold doesn't respect 2417.50 to the cent; it respects the 2415–2420 area. Traders who draw razor-thin lines get "fake-outs" all day; traders who draw zones see the same price action as normal behaviour.
Gold's two signature level behaviours
1. Round-number magnetism
XAUUSD gravitates to and fights over round numbers — 2400, 2450, 2500 — plus the half-levels (2425, 2475). Why: option strikes, institutional orders and human psychology all anchor there. Practical use: mark the round numbers within the day's range before looking for anything else; half your S/R map draws itself.
2. The wick-hunt (read this twice)
Gold's most expensive habit: price approaches an obvious level, pierces it by a dollar or two, triggers the cluster of stop-losses parked just beyond, then reverses hard — leaving a long wick. It's visible on almost any XAUUSD chart, and it's why we flagged wicks in the slippage guide.
The defensive rule: never place stops at the obvious level — that's where the hunt goes. Place them beyond the wick zone (ATR-sized, per the indicator guide), and treat a pierce-and-reclaim of a level as information, not failure.
Drawing levels that deserve the ink
- Higher timeframe first: daily/4H levels outrank 15-minute squiggles. Three touches on the daily beats thirty on the 5-minute.
- Mark zones: a band covering the cluster of wicks/closes, typically $3–8 wide on gold depending on volatility.
- Fewer, stronger: if your chart has twelve lines, you have none. The 3–5 levels everyone can see are the ones that act.
- Include the structurals: previous day's high/low, week's high/low, and the round numbers — the levels the whole market shares.
Trading levels: bounce vs break
| Play | Setup | The discipline |
|---|---|---|
| Bounce | Price reaches a zone with the higher-TF trend behind the bounce direction | Wait for rejection evidence (reclaim, momentum shift) — a level touch alone is not an entry |
| Breakout | Price closes decisively through a zone, ideally in liquid hours | Beware the wick-hunt fake: a close beyond the zone in the London–NY window counts; a spike doesn't |
Both plays fail regularly — that's normal. The stop-loss placed beyond the zone (not at it) converts failures into small planned costs. Everything else is the standard framework: 1–2% risk, liquid hours, the same rules every time.
Common level mistakes on gold
- Trading the touch — entering because price arrived, without rejection evidence.
- Line-thin stops — donating to the wick-hunt daily.
- Counter-trend catching — "it's at support!" during a macro sell-off; strong trends slice through minor levels (drivers outrank lines).
- News-time levels — during NFP/CPI seconds, zones mean nothing; execution chaos rules.
How rule-based systems use levels
EAs encode the same structure numerically: recent swing highs/lows, round-number proximity, previous-day extremes — as conditions (filters, targets, invalidation points) rather than hand-drawn art. That's the honest overlap between chart reading and automation we described in how robots work: levels become math, and the wick-hunt becomes an ATR-buffered stop rule instead of a repeated surprise.
Where our robot stands: the free XAUUSD Robot uses structural levels as context within its trend logic — with stops always ATR-buffered beyond obvious zones, precisely because of the behaviour this guide describes.
Get the Free Gold Robot →Questions we get
What is support and resistance in trading?
Zones of clustered buying/selling interest — floors and ceilings the market remembers. Areas, not lines.
Why does gold react to round numbers?
Options, orders and psychology anchor there — 2400/2450/2500 act as magnets and battlegrounds.
What is a liquidity grab or wick-hunt on gold?
Price pierces a level, triggers parked stops, reverses. Defend with ATR-buffered stops beyond the zone.
How do I draw support and resistance correctly?
Daily/4H zones, $3–8 wide, only the clearest 3–5 plus prev-day/week extremes and round numbers.
Should I buy at support and sell at resistance?
Only with rejection evidence and trend context — a touch alone isn't a signal.
Do trading robots use support and resistance?
Yes, numerically — swing/round-number conditions with ATR-buffered stops.
The verdict
Support and resistance on gold rewards the trader who respects how the metal actually behaves: zones instead of lines, round numbers as the skeleton, and healthy paranoia about the wick just beyond every obvious level. Draw fewer, stronger zones; demand confirmation; park stops where the hunt can't reach them. Do that and levels become what they should be — context that improves every strategy, rather than bait that funds everyone else's.
Want a second pair of eyes on your levels?
Send us your marked-up chart — honest feedback, no charge.
💬 Talk to Us on TelegramMore from the lab
Risk & affiliate disclosure: Educational content only, not financial advice. Trading gold (XAUUSD), forex and CFDs carries substantial risk of loss; a large majority of retail CFD accounts lose money. No results are guaranteed. We may earn a commission if you open an account through partner links, at no extra cost to you — this funds the free EA. See our Affiliate Disclosure.