The MT5 Strategy Tester, Operated Properly
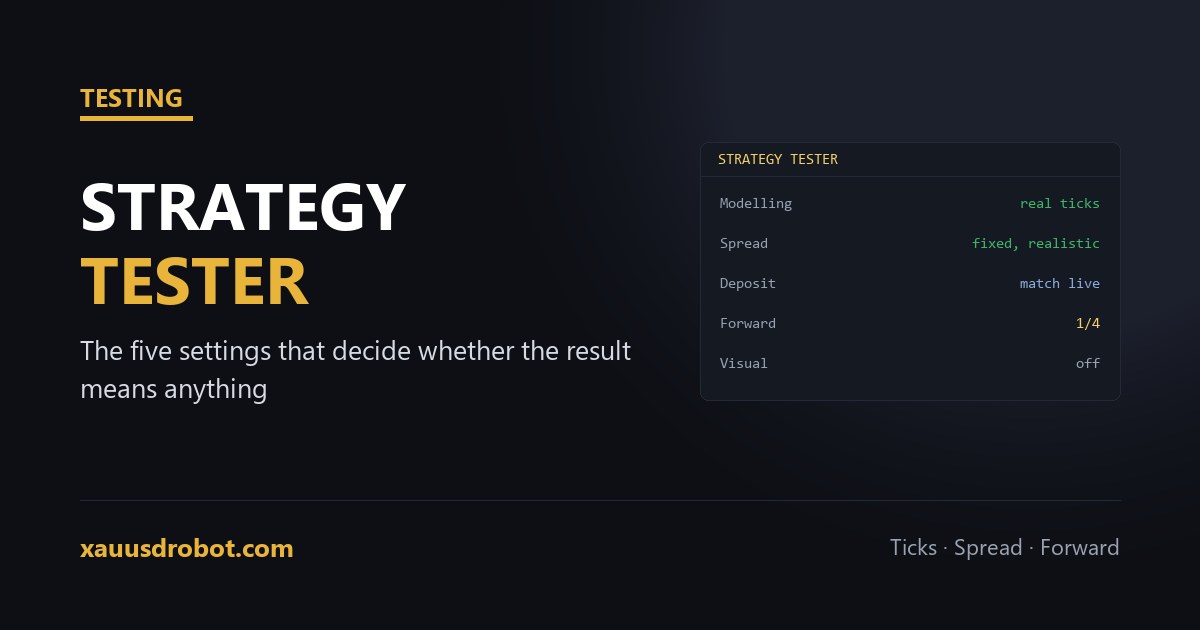
TL;DR Open it with Ctrl+R. Five settings decide whether the result means anything: modelling — use Every tick based on real ticks, nothing else on gold; spread — set a realistic fixed value rather than “current”; deposit and leverage — match the account you will actually trade; period — long enough to include a trending and a ranging stretch; forward — set to 1/4 or 1/3 so part of the data stays unseen. In the report, read maximal equity drawdown before profit, and treat trade count under about 100 as too small to conclude anything.
Opening it, and the four fields that matter first
View → Strategy Tester, or Ctrl+R. The panel that appears has more options than anyone needs on day one, so start with four:
- Expert — the advisor to test.
- Symbol — the exact instrument, including any broker suffix. XAUUSD and XAUUSD.m are different symbols with different histories.
- Period — the chart timeframe the advisor expects.
- Date range — long enough to matter, which on gold means at least a couple of years.
Everything else in the panel adjusts how faithfully the simulation reproduces live conditions, which is where most misleading backtests are made.
Modelling: the setting that decides whether any of it is real
| Mode | What it simulates | Use it? |
|---|---|---|
| Every tick based on real ticks | Actual recorded tick data from the broker | Yes — the only mode worth trusting |
| Every tick | Ticks generated from minute bars | Rough approximation; acceptable for a first look |
| 1 minute OHLC | Four prices per minute | Fast and misleading for anything touching intrabar movement |
| Open prices only | One price per bar | Useless for gold; produces flattering nonsense |
The lower modes exist because they are fast, and speed is exactly the wrong thing to optimise for here. On an instrument with gold's intrabar range, a stop-loss can be reached and the price recover inside a single candle — a detail the coarse modes cannot see, so they report a winning trade that would have lost.
Real-tick data has to be downloaded from the broker the first time and can take a while. Let it finish.
Spread, deposit and leverage
Three fields quietly determine whether the equity curve resembles anything you could have traded.
Spread. Leaving it on “current” uses whatever the spread happens to be right now, which on a quiet afternoon flatters everything. Set a fixed value at or slightly above your broker's typical gold spread. If you do not know it, watch Market Watch across a full session first — what gold's spread really costs covers why this matters more than it looks.
Deposit. Match the balance you will actually fund. An advisor sizing positions as a percentage of balance behaves completely differently on $10,000 than on $500, and testing the wrong figure tells you about an account you do not have.
Leverage. Match the account too. It changes margin, which changes whether some positions could have been opened at all.
Forward testing, inside the tester
The Forward dropdown is the most underused control in the panel, and it is the one that catches over-optimisation.
Set it to 1/4 or 1/3 and MT5 splits the date range: it optimises on the earlier portion and then runs the winning settings on the later portion, which the optimiser never saw. Two result tabs appear.
How to read it: if the back period looks excellent and the forward period falls apart, the settings were fitted to history rather than to a durable behaviour. That is the single most common way a promising advisor turns out to be nothing — and this dropdown surfaces it in one run.
A result that holds up reasonably in both halves is worth taking further. The full methodology sits in how to backtest a gold EA properly.
Visual mode, and when it earns its time
Ticking Visual mode replays the test on a chart, showing entries and exits as they happen. It is far slower, so it is not for producing results — it is for understanding them.
Use it when the numbers surprise you. Watching where an advisor actually enters answers questions a report cannot: whether it is trading the setup you expected, whether it is entering mid-move, whether its stop sits somewhere ordinary noise reaches. Ten minutes of visual replay often explains a month of confusion.
Reading the report without fooling yourself
The report leads with total net profit, which is the least useful number on the page. Read in this order:
- Maximal equity drawdown. Not balance drawdown — equity, which includes floating losses. This tells you what you would have had to sit through. Treat it as a floor: live is usually worse.
- Total trades. Under roughly 100 the result is noise. A 12-trade backtest describes luck.
- Profit factor. Gross profit over gross loss. Comfortably above 1.0 is meaningful; above 3.0 on a small sample usually signals fitting.
- The equity curve shape. Steady beats spectacular. A curve that is flat then vertical is one lucky period carrying the whole test.
- Modelling quality. Shown as a percentage. Anything low means the data was not good enough to trust the rest.
And the number that is not in the report: slippage. The tester fills at the modelled price, while a live account fills at whatever was available — a gap explained in why live fills beat backtests.
Questions we get
How do I open the Strategy Tester in MT5?
Ctrl+R, or View then Strategy Tester. Then pick the advisor, exact symbol, timeframe and date range.
Which modelling mode should I use for gold?
Every tick based on real ticks. Coarser modes miss intrabar moves and turn losing trades into winners.
What is forward testing in the Strategy Tester?
It hides part of the date range from the optimiser, then tests on it. A collapse there means the settings were curve-fitted.
What spread should I set when backtesting?
A fixed value at or above your broker's typical spread. 'Current' flatters results by using a quiet moment.
Which number in the backtest report matters most?
Maximal equity drawdown — it shows the worst stretch you would have had to endure, and live is usually worse.
How many trades does a backtest need to mean anything?
About 100 minimum. Below that the outcome is mostly luck rather than evidence of an edge.
The verdict
The Strategy Tester is honest if you configure it honestly. Real ticks, a realistic spread, the deposit you will actually fund, a period long enough to include more than one kind of market, and a forward segment the optimiser never sees. Do that and the report becomes evidence — skip any of it and you have produced a very convincing picture of a strategy that never existed.
Backtest looking too good to be true?
Send us the report and your tester settings. We will tell you which of them is producing the flattering number.
💬 Talk to Us on TelegramMore from the lab
Risk & affiliate disclosure: Educational content only, not financial advice. Trading gold (XAUUSD), forex and CFDs carries substantial risk of loss; a large majority of retail CFD accounts lose money. No results are guaranteed. We may earn a commission if you open an account through partner links, at no extra cost to you — this funds the free EA. See our Affiliate Disclosure.